DASHBOARDS - TAILWEBS
logo

Untangle messy data with clean value-driven data visualisation solutions!

We craft customized intelligent digital dashboards, reports, and tools to help transform large data sets into useful information that is educational and easy to digest.

Click on the link above to schedule a FREE consultation of 30 minutes instead of Rs. 10,000/- with SIDDHARTH KAJARIA now!

4.1

Google Reviews

55 Reviews

Trusted by various Industries, Think Tanks & Indian Government organisations such as -

Compress large data sets into easily digestible dashboards

Why do you need customised
Intelligent Dahsboards?

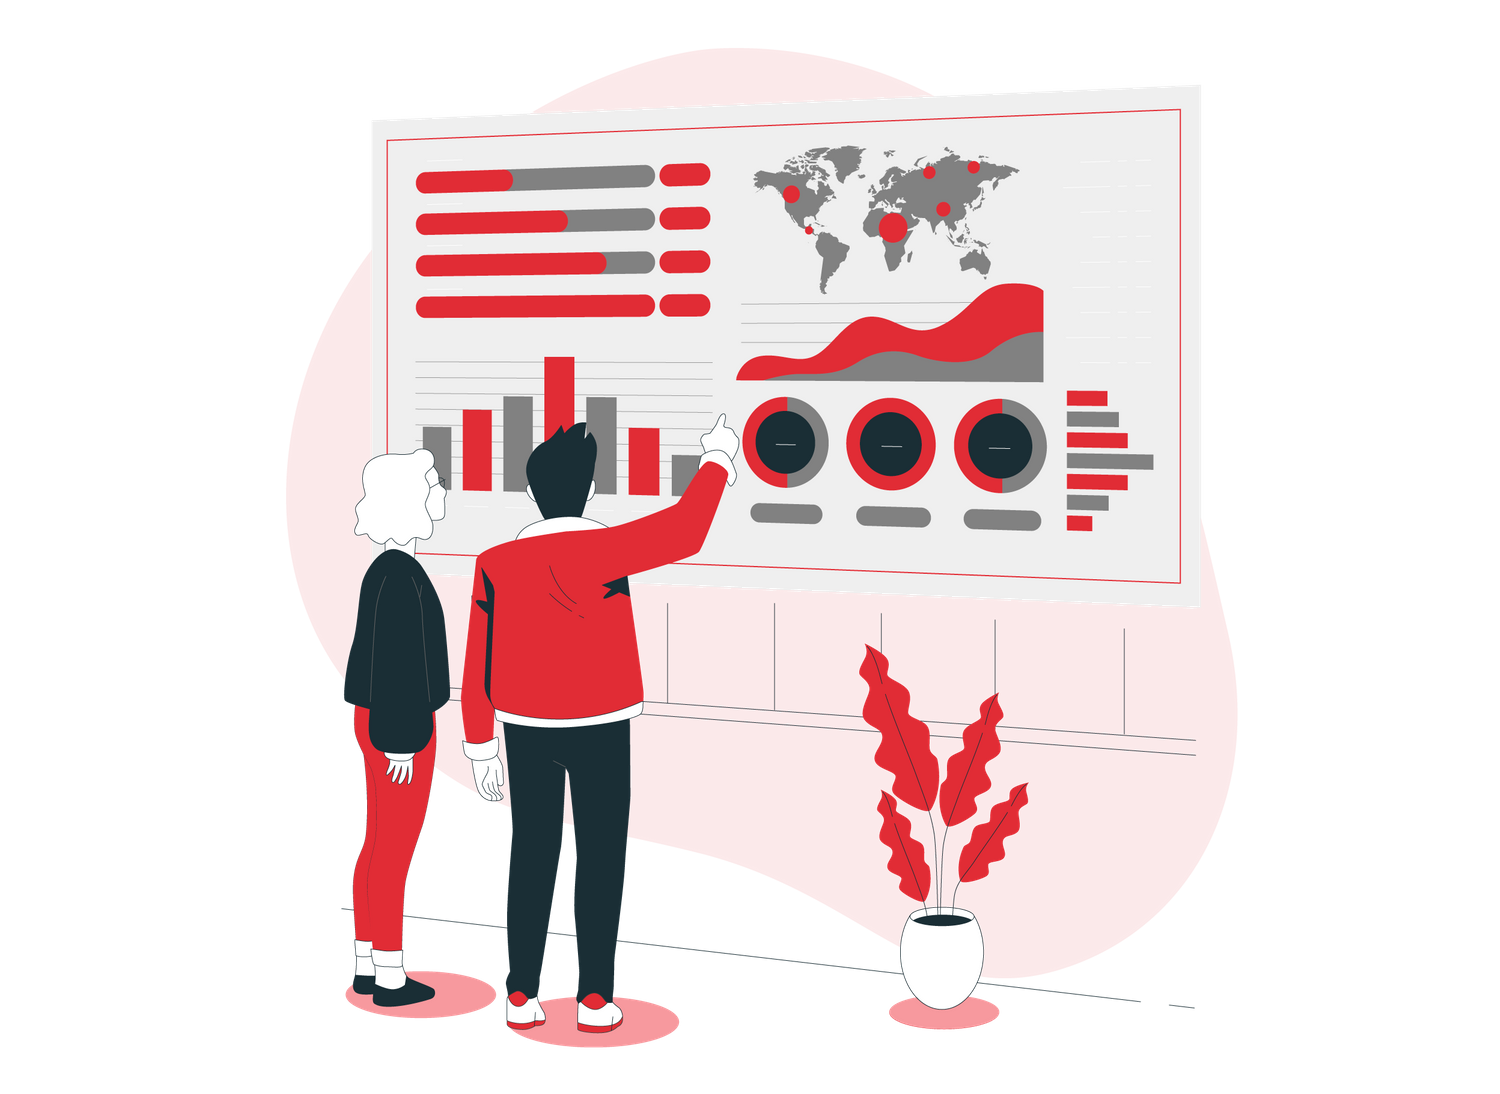
If no visualization is used, be it a simple graph or a comprehensive data visualization dashboard, extracting useful information or drawing conclusions from large data sets with thousands or millions of data points is nearly impossible. So what happens when you don’t have a clean data visualization solution?

We know it’s not practical to share a huge set of excel sheets with your users. What if all that voluminous data could be compressed into intelligent dashboards and easily shared with concerned members? 

Isn’t it better than looking at cumbersome excel sheets? Better yet, what if you could have on-demand access to a single report for different research needs? 

When data visualization expertise is lacking, you’ll be stuck in putting together a dashboard rather than taking action on a ready-made visualization and moving forward. 

With access to a huge amount of data, it’s challenging and stressful to visualize data that may not be appealing and easily digestible.

Looking to outsource your data visualization work to someone reliable? Talk to us today!

Let us tell you a bit about: Our process

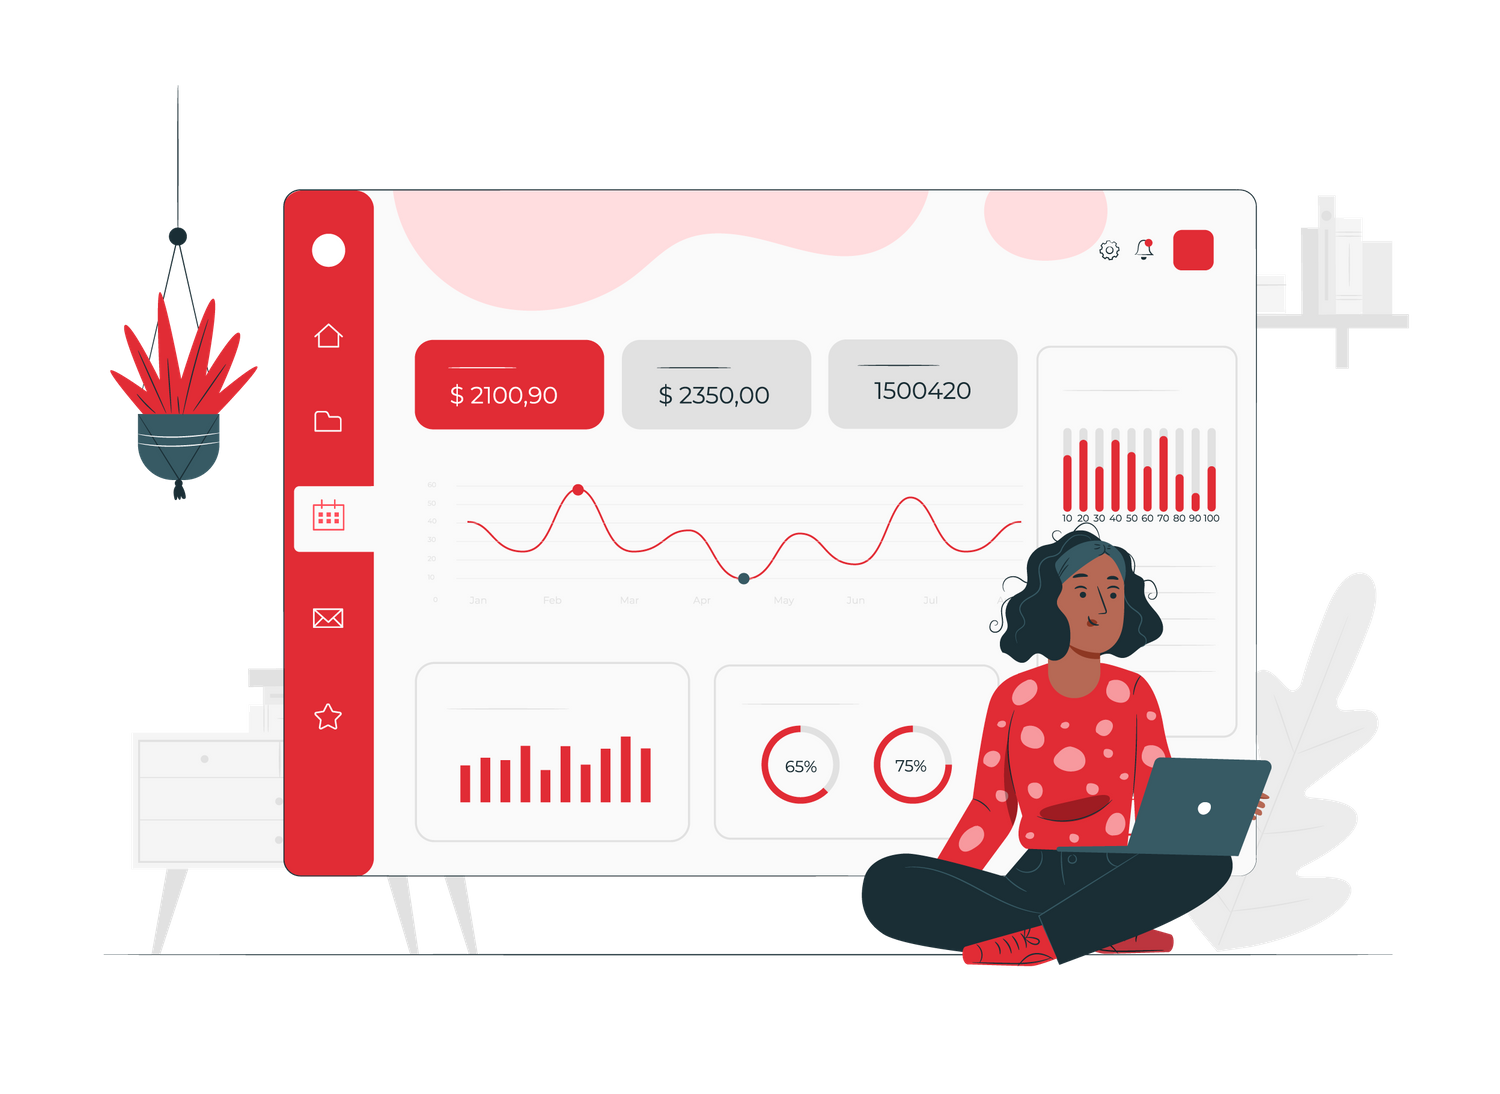
With a large amount of data in various forms; PDFs, Excels, static data, incomplete information, too much clutter, and poor visualization, it can be difficult to comprehend and make inferences. We provide you with customized digital dashboards/reports as well as customized digital tools for your specific function.

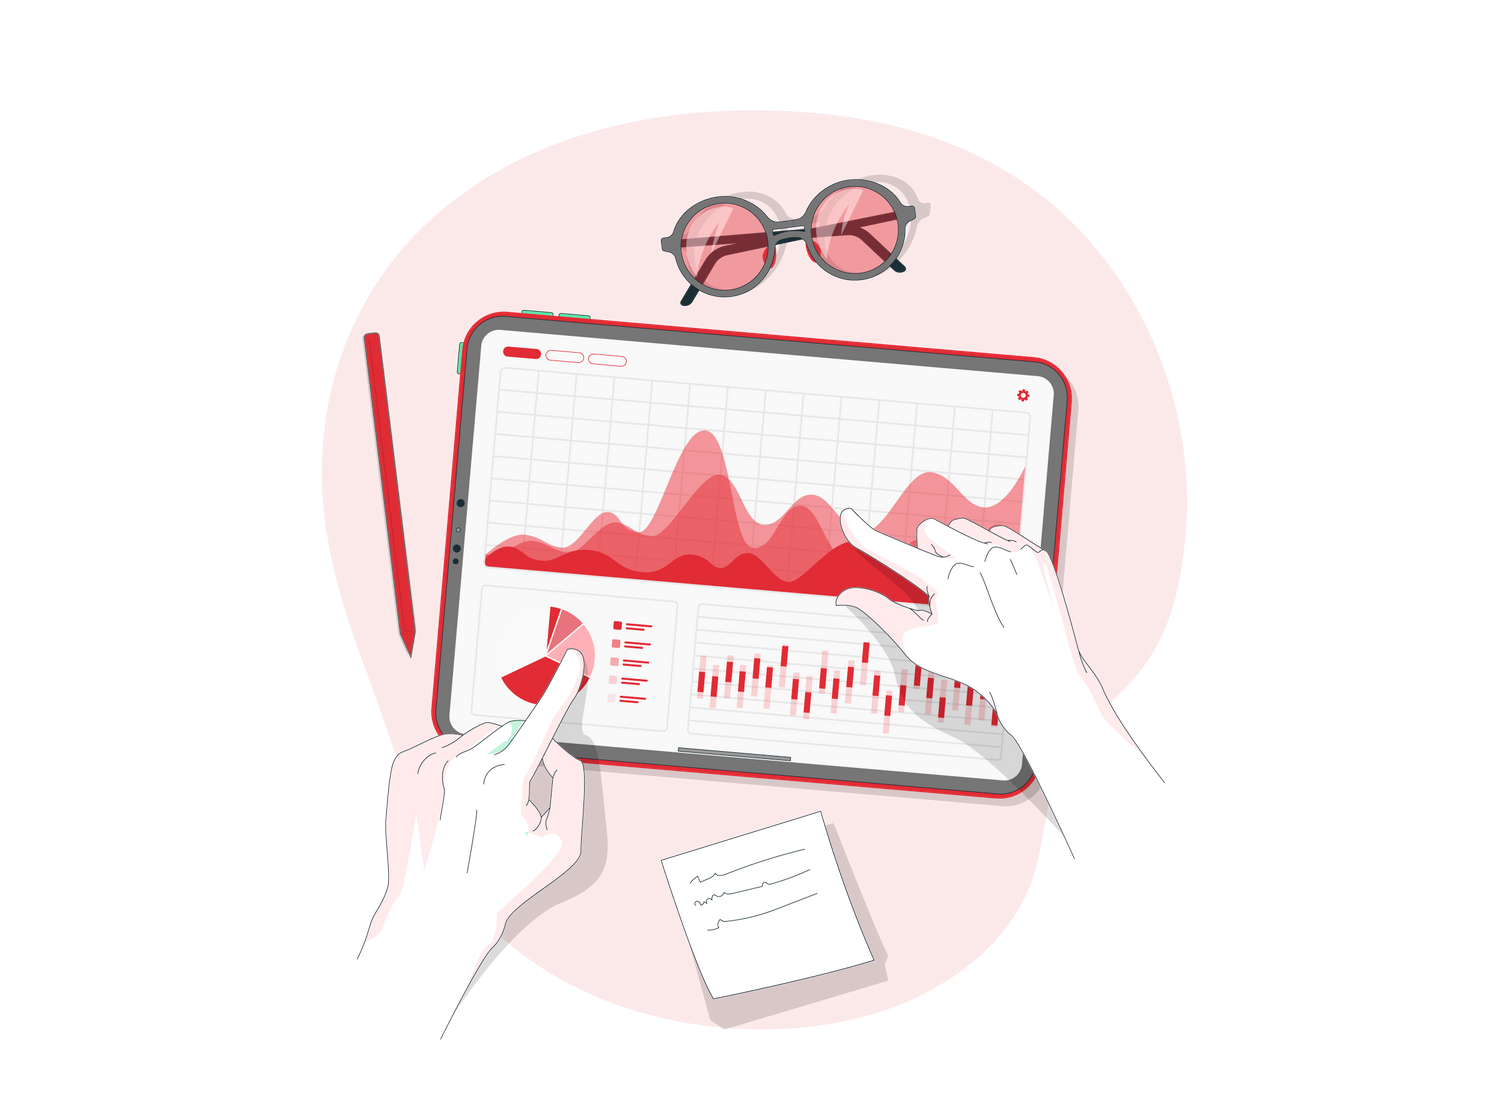
Here is our process to help you sort your data and make it more digestible:

Our team of data visualization professionals first gathers your company requirements and goals.

After gaining a thorough grasp of your company's objectives and demands, we choose the solution, strategy, and technology that will best serve your needs by creating a mind map and declutter.

We design dashboards keeping the end users in mind because we know building a narrative is easier when dashboards are simple to understand.

To convert the datasets into proper forms, our experts use highly scalable data processing scripts and incorporate them into customized dashboards. 

We aim to provide Useful data visualization specifically customized to solve your problem statements.

Open access to all the users may not be a smart choice so we implement role-based access that allows null, partial, and full access to people across different functions.

Let us turn your vision into visualization. To know more about our process, talk to us today!

Industries we have catered to

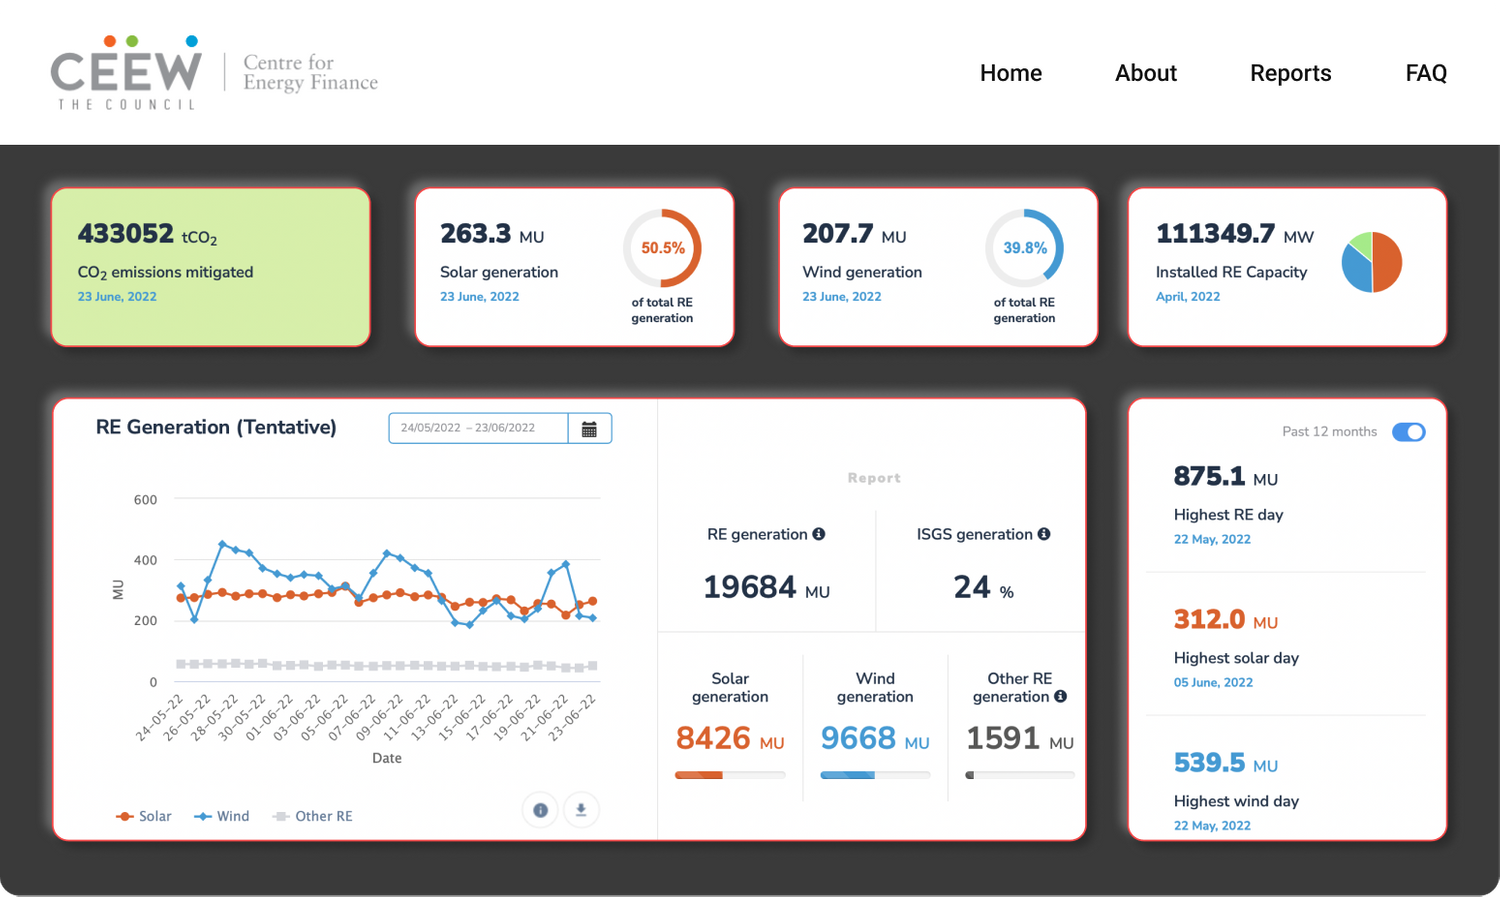
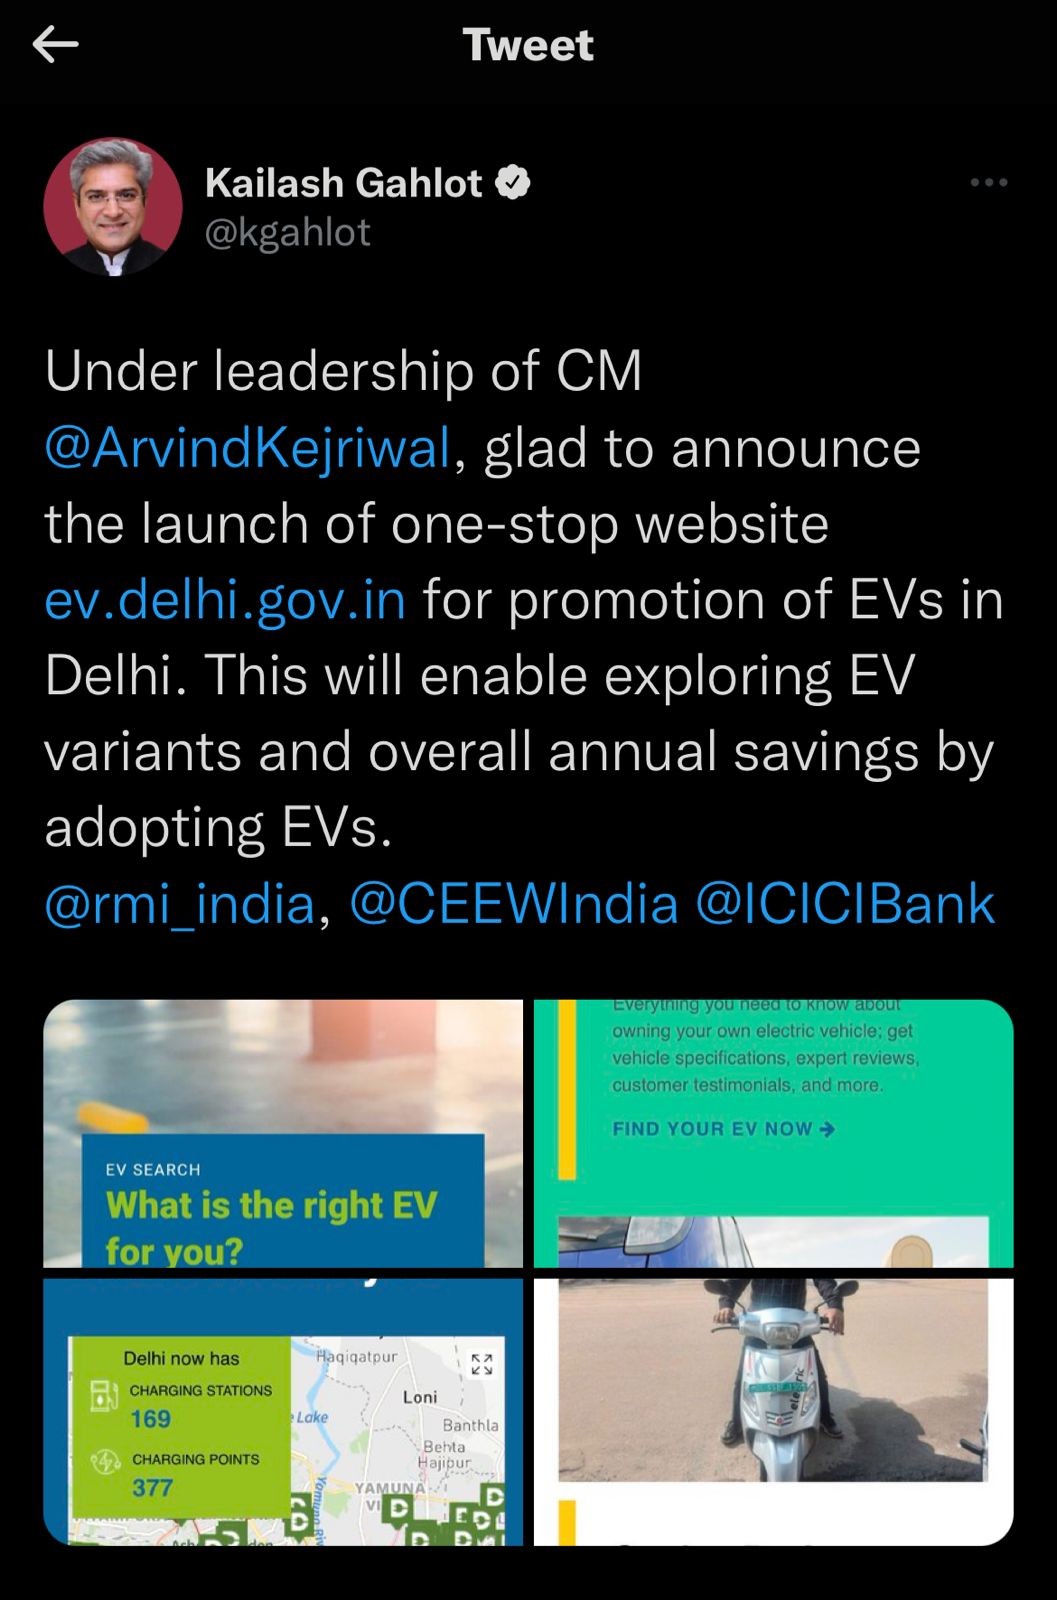
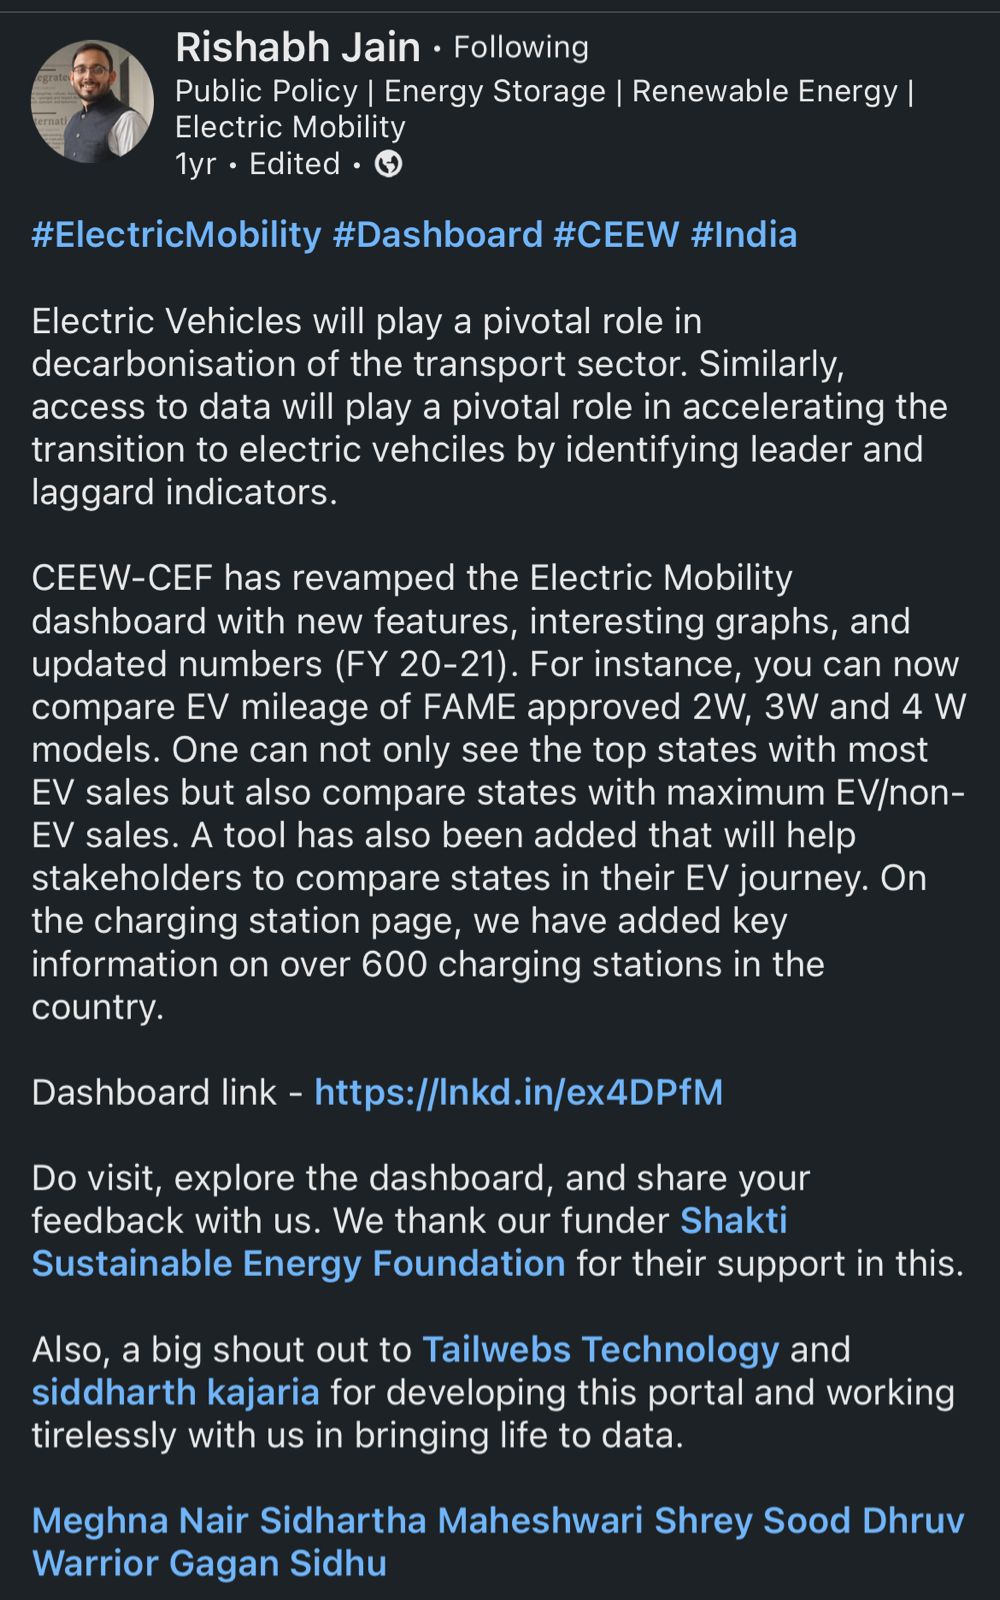
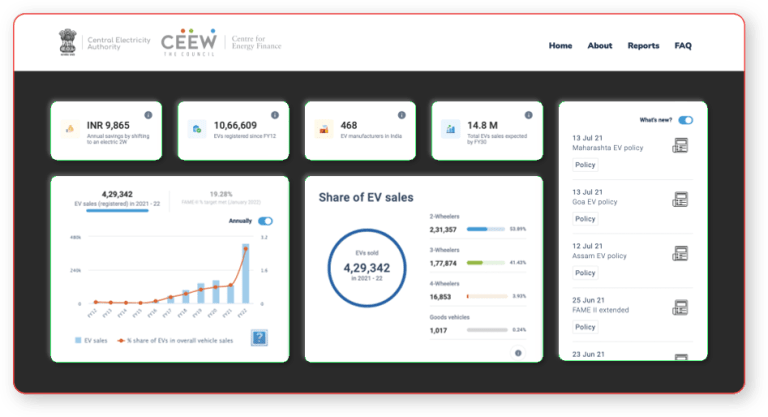
We were fortunate to have worked with Indian Government organizations such as the Central Electricity Authority (CEA) and the CEEW Centre for Energy Finance (CEEW-CEF) to help build dashboards to track electric mobility and renewable energy. But we don’t wish to stop here! We’re confident that the same quality of work will be translated to other industries like

Any Data heavy Research Centre

Agriculture

Insurance

Manufacturing & Natural Resources

Education

Healthcare Providers

Irrespective of the industry, we’re committed to delivering customized intelligent dashboards that cater to your specific needs. As long as your company is data-heavy and needs help visualizing large data sets, we’re here for you! 

Data visualization requires attention to detail yet a good understanding of the big picture. We’ll help you get there. 

Why a customised solution with us & not a dashboard building tool?

Boost the power of absorbing information faster, improving insights, and making decisions quickly with our customized dashboards. Play around, filter, and run queries where ever needed to view relevant information. That’s right, we make our dashboards not just easily digestible but also interactive!

Nobody likes looking at boring charts and graphs. We make our dashboards fun, interactive, and educational so the end users keep coming back for more. 

We transform the dashboards into a form that’s easy for you to digitalize your research work — so there’s improved retention and distribution of information across your organization as well as to your end-users.

Not another data visualization tool. We are a team of humble data visualization experts who will be working hard to make your intelligent dashboard stand out and showcase information in a straightforward manner. Most importantly, we are not restricted by any design tool. The sky is the limit.

With data visualization expertise outsourced, you can instead worry about actioning on the ready-made visualizations. The intelligence within the dashboard is enough to get you moving. High efficiency, more success for your organization.

We take pride in providing super responsive IT support. Our regular IT checks ensure everything’s good in the hood.

Make data work for you with customized & interactive data visualization solutions.

Want to stand out in the crowd?

Why settle with dashboard creation tools?

Data visualization requires attention to detail yet a good understanding of the big picture. We’ll help you get there. 

Ready to take action?

We ensure you get the best because you deserve it

The data you have has the ability to provide immense knowledge and helps many in their decision making! You know it. However, they are sitting in unorganised dashboards and excels, which is reducing it's value. Let's not let that happen, Let's derive value from your data and give your research the justice it deserves!

It absolutely free! It just requires your time!